
Strong IT decisions need more than instinct or a dashboard. They require reliable, relevant data tied to a clear business goal. Evidence can guide technology choices, help assess trade-offs and give leaders a basis for reviewing results. It informs judgement, but does not replace accountability.
When technology costs, performance and risk are spread across teams and systems, it can be difficult to see which issue needs attention first. A consistent approach helps leaders compare evidence, test assumptions and connect IT priorities with business needs.
This article explains data-driven IT decision making and how descriptive, diagnostic, predictive and prescriptive analysis can inform choices. It also explores how a supportive data culture helps teams use information responsibly, then sets out practical ways to apply evidence to IT decisions in South Africa.
Key Takeaways
- Start with a specific business question, then choose data and measures that can help answer it.
- Use descriptive, diagnostic, predictive and prescriptive analytics to move from understanding past results to weighing possible actions.
- Bring internal business intelligence and market research together, while maintaining data quality and clear governance.
- Build a culture where teams can interpret evidence, test ideas and track outcomes against relevant measures.
- Apply these practices to IT priorities to strengthen financial control, operational decisions and risk oversight.
What is data-driven decision-making?
Data-driven decision-making uses relevant evidence to guide business choices and operational actions. In IT, data-driven IT decision making connects a defined objective with analysis, useful indicators and accountable judgement.
-
Distinguish the analytics approaches
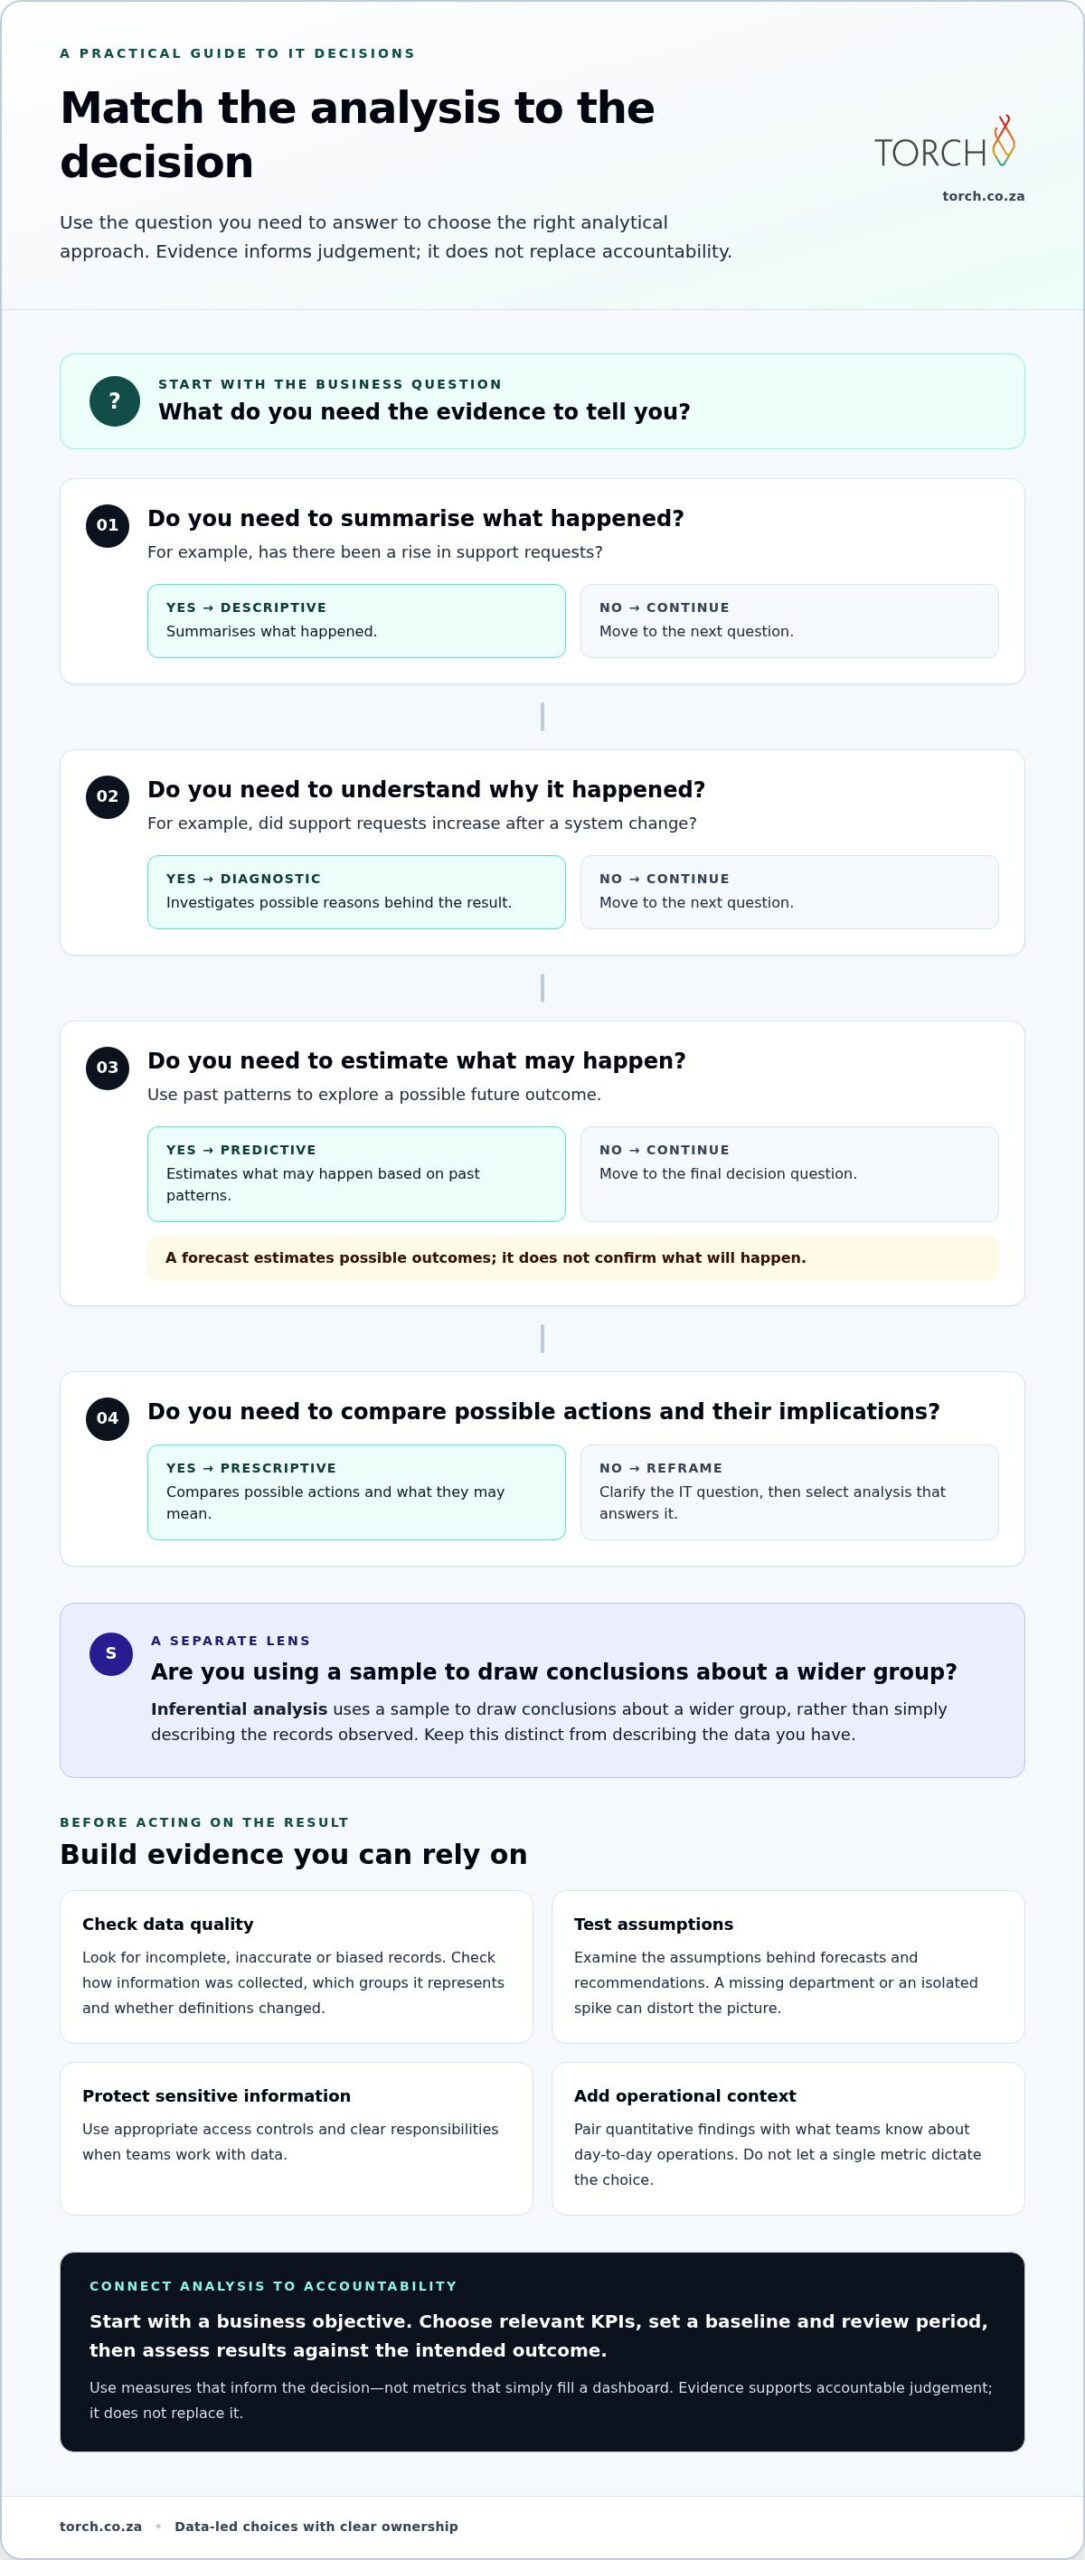
Choose the type of analysis that answers your IT question. Descriptive analytics summarises what happened, such as a rise in support requests. Diagnostic analytics investigates why, perhaps by examining whether requests increased after a system change. Predictive analytics uses past patterns to estimate what may happen, while prescriptive analytics compares possible actions and their implications.
Inferential analysis uses a sample to draw conclusions about a wider group, rather than simply describing the records observed. Keep these methods distinct, and don’t mistake a forecast for a confirmed outcome. Matching the analytical approach to the decision helps data-driven IT decision making produce useful evidence without unnecessary complexity.
-
Align analytics with objectives and KPIs
Start with the business objective, then select key performance indicators (KPIs) that show progress. If the aim is better service continuity, for example, define which incident or availability measures reflect that goal. Set a baseline and review period so teams can compare results consistently and judge whether a change supports the intended outcome.
Check that every metric informs the decision rather than simply filling a dashboard. Data visualisation can help leaders identify patterns across indicators, but it cannot fix a poorly framed question. Purpose-built BI models can organise measures around business objectives, linking analysis to financial control and operational priorities.
-
Build data proficiency and analytics agility
Help teams interpret metrics, question assumptions and explain findings in plain English. For example, an IT manager reviewing a service trend should distinguish a sustained change from an isolated spike. Shared definitions also help finance, operations and technology teams discuss the same evidence without mistaking differences in measurement for differences in performance.
Enable teams to investigate new questions and refine their analysis as evidence develops. A community of analysts and decision-makers can share methods, context and lessons from testing ideas. Clear access and responsibilities help wider participation support consistent analysis, rather than creating conflicting versions of an indicator or weakening governance.
-
Assess risks and limitations
Test data quality before acting. Incomplete, inaccurate or biased records can produce misleading patterns. A service report that omits one department, for instance, may distort comparisons across teams. Check how information was collected, which groups it represents and whether definitions changed during the period analysed.
Examine the assumptions behind forecasts and recommendations. Predictive analysis estimates possible outcomes; it cannot establish what will happen. Protect sensitive information with appropriate access controls, and pair quantitative findings with operational context. Data-driven IT decision making works best when evidence informs accountable judgement, rather than allowing a single metric to dictate the choice.
What is a Data-Driven Culture and how does it support DDDM approach?
Organisations build a data-driven IT decision-making process by connecting business goals to trusted information, clear measures and accountable action. Teams can then review results and adjust their practices as evidence develops.
-
Identify data sources across teams
Map internal sources across finance, IT, operations, sales and customer support. Finance records, for example, can show expenditure, while IT service records reveal recurring support issues. Add business intelligence reports and relevant market research when they help answer the same decision question. Record each source’s owner, update frequency and definitions so teams can distinguish current operational signals from older context.
Check for gaps before combining sources. A report comparing departments may mislead if one team records incidents differently. Centralising information can help organisations compare perspectives, but shared definitions and ownership preserve meaning. Use visualisation to present connected indicators clearly, rather than placing unrelated measures together on one dashboard.
-
Choose KPIs aligned with business goals
Translate each business goal into a question, then choose KPIs that show progress. If the goal is to improve support responsiveness, for example, select indicators that reflect response and resolution, not simply request volume. Set a baseline and review cadence, then assign an owner who can explain changes and coordinate action.
Prioritise measures that inform a decision. A dashboard crowded with activity metrics can obscure whether an initiative supports business outcomes. S&P Global Market Intelligence reported that 96% of respondents highlighted the importance of using data in decision-making. That finding reinforces the value of connecting measures to decisions, rather than collecting metrics without a defined purpose.
-
Use business intelligence and warehousing tools
Choose business intelligence tools and a data warehouse based on the questions teams need to answer. A warehouse can bring finance, service and operational records into a consistent structure; BI tools can then support dashboards, exploration and visualisation. Define common measures before building reports, and document how each indicator is calculated.
Design access around roles and decision needs. For example, an executive dashboard may show trends, whilst an analyst needs detail to investigate a change. NewVantage Partners reported that 98.6% of executives said their organisations aspired to a data-driven culture, while 32.4% said they had succeeded. Tools alone don’t close that gap; people need confidence and clear practices.
- Make evidence part of business practice. Give teams a repeatable route from question to action: review relevant sources, discuss patterns, record the decision and monitor its outcome against KPIs. This makes learning visible across the organisation. For example, a service team can document whether a process change affected the measure it was intended to improve, then share that learning with finance and IT.
Use the review to identify growth opportunities as well as operational issues. If market research suggests changing customer needs, compare that signal with internal service and product information before changing priorities. A shared community of decision-makers can bring context to those comparisons and challenge assumptions. To discuss how to structure this process, work through your data-governance priorities.
Benefits of data-driven decision-making
Evidence can help IT leaders improve efficiency, manage costs and strengthen customer experience. Its value becomes clearer when teams connect decisions to measurable outcomes and review what changes.
-
Improve efficiency, costs and customer experience
Measure a process before changing it, then compare the same indicator afterwards. Analysing service requests, for example, may reveal repeated delays at a particular hand-off. Addressing that bottleneck can help teams use capacity more effectively and resolve customer issues with less friction.
Review expenditure alongside performance trends when assessing IT costs. A lower-cost option may create extra support work or weaken security controls, so consider its wider operational impact. Track financial and service outcomes together to see whether a change improves efficiency without shifting the burden to users or other teams.
-
Reduce bias and set measurable goals
Define a measurable goal before selecting an intervention. A team seeking to improve service responsiveness, for example, can compare request trends and resolution measures before and after a process change. Clear criteria reduce reliance on the loudest opinion while still allowing staff to explain operational context that the data may not capture.
Check whether records represent the teams, users or systems affected by the decision. Incomplete data can skew comparisons, and historical patterns may reflect earlier assumptions. Review how measures were collected, then invite relevant teams to challenge the interpretation. This makes analysis more balanced, but does not remove the need for accountable judgement.
-
Make more confident decisions
Use a clear evidence trail to explain why a decision was made. Link the business question to the data analysed, the options considered and the expected result. A proposal to change an IT support process, for example, is easier to assess when its rationale and intended service measures are recorded before implementation.
After implementation, compare the outcome with the original measure and record what changed. If an IT adjustment aims to reduce recurring incidents, review incident patterns alongside customer feedback. This feedback loop makes effective practices easier to repeat and helps leaders revise decisions when results differ from expectations.
Meaning and importance of data-driven decision making
- Focus on decision value, not data volume. Start with a specific choice, such as whether to renew, replace or consolidate a technology service. Identify which information could change that choice. A large collection of records can still be unhelpful if it does not answer the decision question or distinguish between realistic options.
For example, a technology review could compare usage patterns, service performance and contract terms. Each source informs a different part of the assessment. Retain evidence that helps evaluate the options, and set aside detail that adds complexity without affecting the comparison. This keeps analysis focused on a business outcome, not data collection for its own sake.
- Make the decision criteria explicit. Before selecting an IT option, record the outcomes that matter, such as operational efficiency, service quality, financial control or managed risk exposure. Clarify which criteria are essential and where trade-offs are acceptable. This makes the reasoning visible to finance, IT and business teams instead of leaving the choice to an unrecorded preference.
An option requiring less operational effort may still raise security or continuity concerns. Compare the available evidence against each agreed outcome, then document why one consideration carries greater weight. Explicit criteria help decision-makers explain their reasoning and revisit it when priorities, operating conditions or technology requirements change.
- Turn analysis into accountable action. Assign an owner to each decision and define the implementation work. A technology change, for example, may require a sequence of tasks, communication with affected teams and a record of operational dependencies. Without clear ownership, analysis can remain a recommendation with no one responsible for moving it forward.
Link implementation to a measure that reflects the intended outcome. Review it alongside relevant service and financial indicators so leaders can distinguish a completed change from one that delivered value. Recording responsibilities and results strengthens financial control and accountability, while helping teams identify issues that need attention.
- Use outcomes to build organisational learning. Record the original question, evidence considered, decision, rationale and observed result. If an IT change produces an unexpected outcome, compare the assumptions with what happened. A planned system change, for example, may create a different support burden than anticipated, prompting a revised implementation approach.
This learning loop helps teams refine future decisions as technologies, business priorities and operating conditions shift. The principle is practical: treat data as a decision resource, pair it with accountable judgement and use measured outcomes to inform the next choice. That discipline can support commercial optimisation without mistaking analysis for action.
Torch Services: Telecom Expense Management
Torch Services helps organisations apply evidence-based oversight to telecom expenditure through Telecom Expense Management. This is relevant when finance and IT teams need clearer accountability for telecom spend or want to investigate potential waste before making budget decisions. Reviewing expenditure alongside business priorities can help distinguish governance gaps from necessary operational costs.
For a broader view, purpose-built BI models and IT FinOps-as-a-Service can support analysis across IT spending. Automated User support and asset management can also inform decisions about user needs and technology assets. The right focus depends on the question, such as how to improve financial control or understand how IT resources are used.
For a discussion about applying these services to your organisation, contact Torch Services.
Turn better evidence into lasting progress
Make each technology decision part of a disciplined management cycle. Assign an owner, record the intended outcome and set a point to review whether the decision is working. This keeps priorities connected to business needs as systems, risks and operational demands change.
Data-driven IT decision making is not a one-off analysis exercise. It becomes more valuable when teams can explain how evidence shaped a choice, learn from the result and apply that learning to future priorities. Start with a decision that matters, establish who is accountable and make the outcome visible to the people affected.
With a clear approach, data can support stronger governance without replacing sound judgement. Each considered decision helps build the discipline to respond with greater clarity and purpose.
Take the next step at a pace that works for your organisation, building confidence in the choices ahead.
Frequently Asked Questions
Can you give some examples of DDDM in action?
Yes. An IT team could compare software licence assignments with actual usage before renewal, then adjust allocations based on evidence. It could also review helpdesk categories to identify requests that may benefit from clearer guidance. For infrastructure planning, historical demand and planned business changes can inform capacity scenarios. Each example applies data-driven IT decision making to a practical choice, then assesses whether the action produced its intended result.
How does data help reduce guesswork and improve outcomes?
Data makes assumptions easier to test. If staff believe a system update caused more support requests, for example, compare records from before and after the change and consider other possible factors. This helps distinguish a timing relationship from a likely cause. Documenting the evidence and rationale gives decision-makers a basis for review, especially when results differ from expectations or the issue returns.
What are the benefits of using real-time analytics to guide decisions?
Real-time analytics can help teams respond while an operational issue is unfolding. A sudden increase in failed transactions, for instance, may prompt investigation before more users are affected. Timely indicators can help teams prioritise investigation, allocate support capacity and communicate emerging issues. For data-driven IT decision making, identify which signals require action and assign responsibility so new information leads to a considered response.
What tools can help with data analysis?
The right tool depends on the task. Excel, R and Python can support statistical analysis, while Tableau, Power BI and QlikView can present findings through data visualisation. Business intelligence tools can monitor selected measures, and a data warehouse can organise information from different systems. Choose tools according to the question, users and data structure; buying software alone will not establish an effective decision process.
What does evidence-led IT decision-making mean?
It means using relevant information alongside professional judgement to make technology choices. A team might assess service needs, business priorities and operational constraints before approving a change. The approach records the reasoning and intended outcome, providing a reference for later review. It does not mean every choice must be automated or determined by one metric; accountable people remain responsible for weighing context and trade-offs.
What data and KPIs should guide IT decisions?
Choose information that relates directly to the decision, such as service availability, asset utilisation, recurring incidents, support demand or budget variance. Match KPIs to the outcome at stake: availability choices need service measures, while lifecycle decisions may depend on asset and support information. Keep definitions consistent across reporting periods, and include measures that reveal operational and financial trade-offs, not just the result leaders hope to achieve.