
A dashboard can show what happened, but it cannot make a sound decision for you. IT business intelligence models organise and analyse data from different sources, then present patterns and trends through reports, visualisations and dashboards. They help people make informed decisions, rather than deciding what a business should do or predicting with certainty what will happen.
When business data sits across separate systems, it can be difficult to build a consistent view of performance. BI brings relevant information together so teams can examine it in context. The quality of the resulting insight depends on how well the data is integrated and organised.
This article explains what business intelligence means, how BI systems integrate data and how different models support analysis. It also outlines practical benefits and drawbacks, helping you assess where BI can improve visibility and where careful governance is needed.
Key Takeaways
- Business intelligence turns data into reports and insights, helping teams understand performance without making decisions for them.
- Data integration and clear relationships between information sources help create a consistent basis for analysis.
- Data mining, reporting, descriptive analytics and querying each support a different way to examine business information.
- BI can strengthen visibility and decision-making, but data quality, access and governance affect how useful its insights are.
- For organisations seeking better oversight of telecom expenditure, Telecom Expense Management can support financial control and accountability.
What is business intelligence (BI)?
Business intelligence organises and presents business data so people can understand performance and make informed decisions. Its value depends on useful analysis, accurate information and clear measures linked to business priorities.
BI data analysis activities
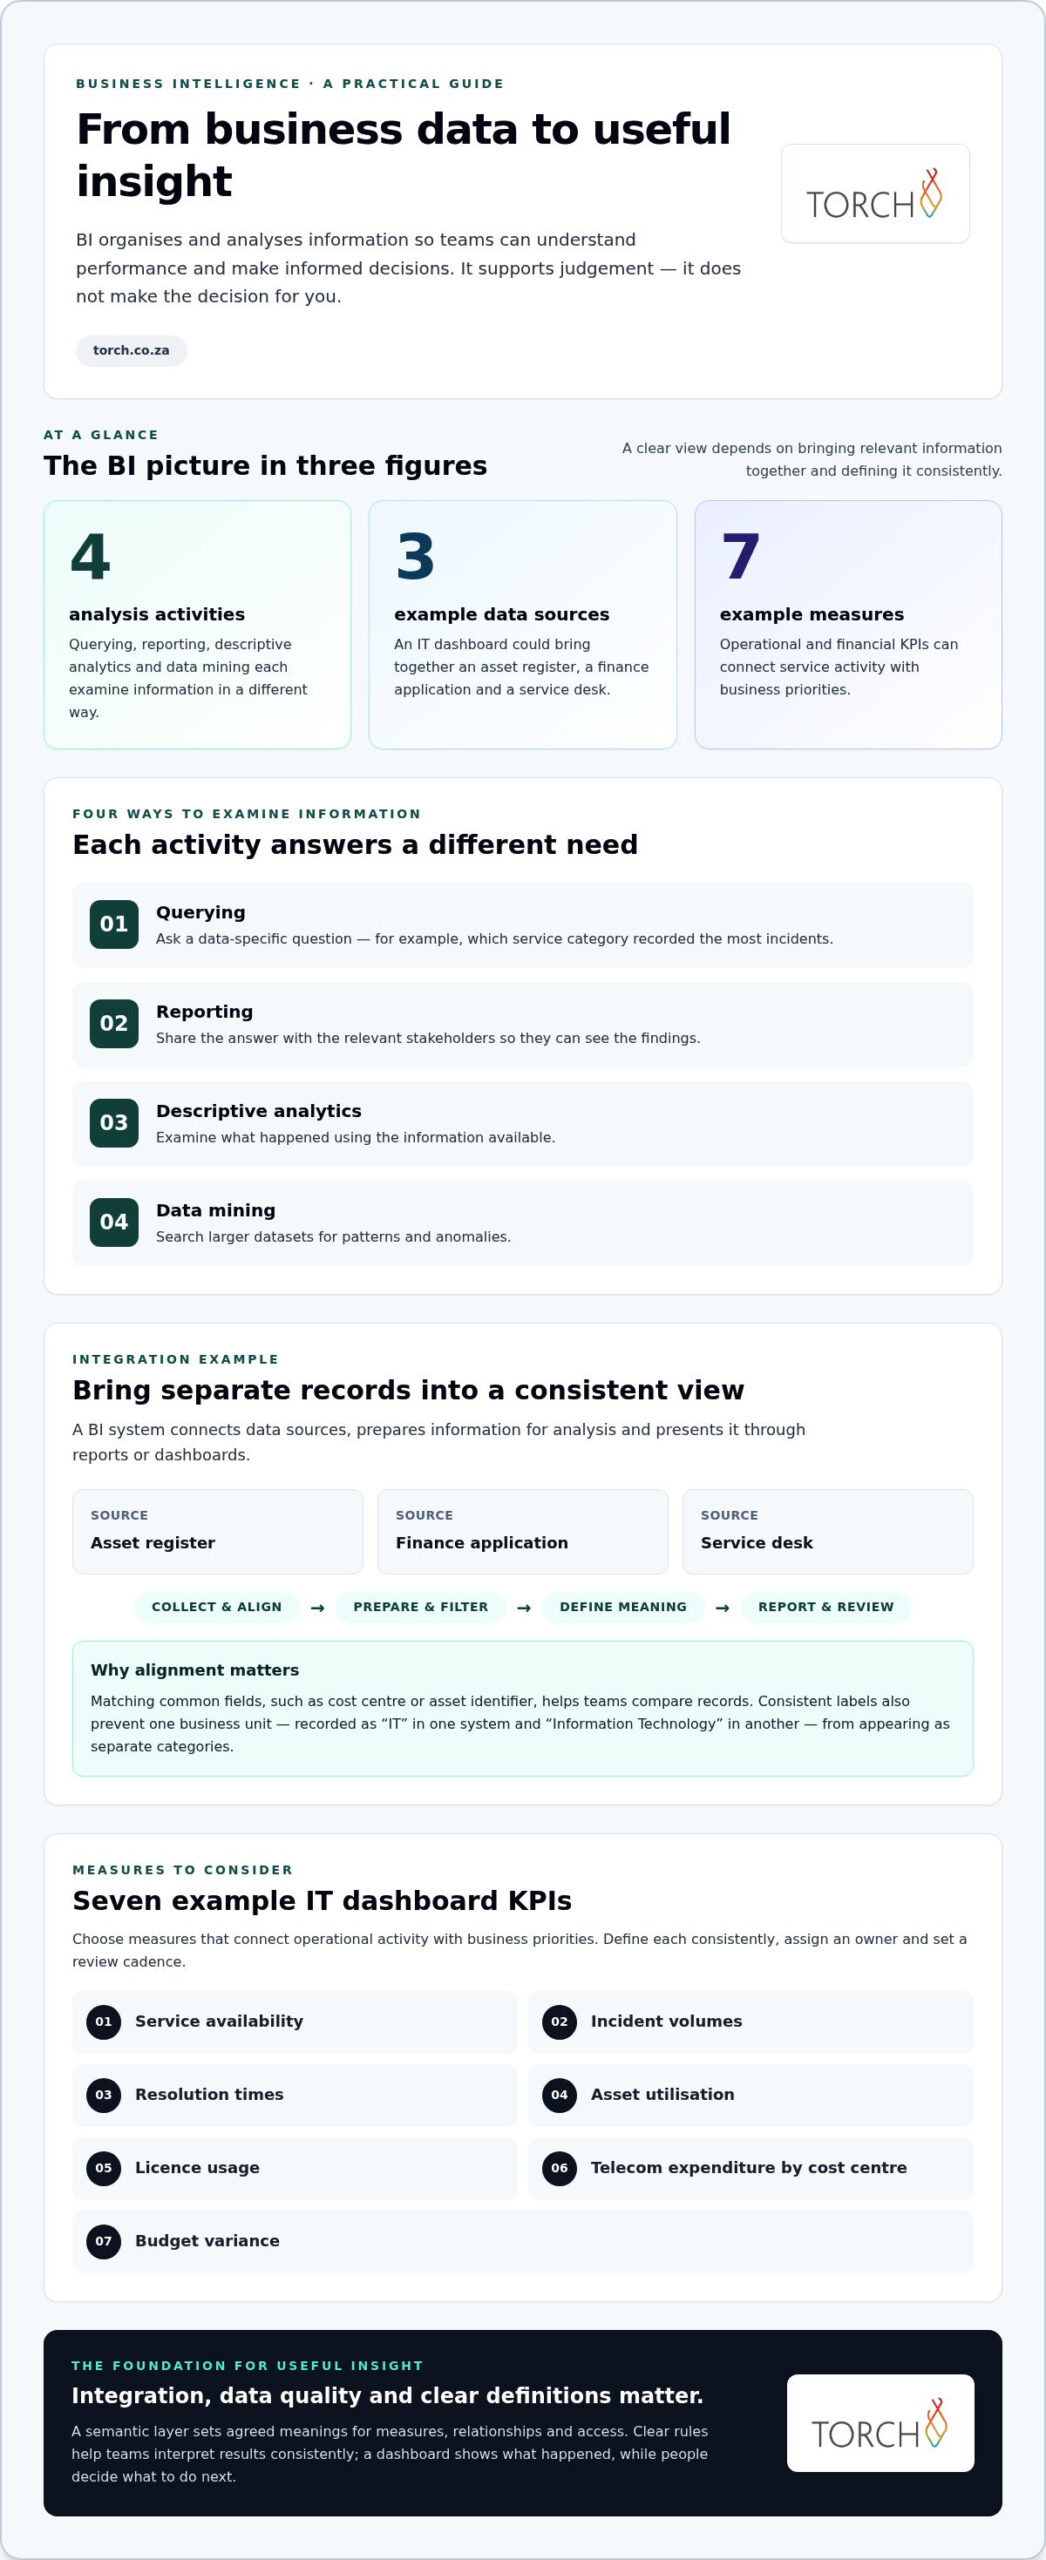
BI analysis uses querying, data mining, descriptive analytics and reporting to turn stored information into usable findings. Querying asks a data-specific question, such as which service category recorded the most incidents; reporting shares the answer with relevant stakeholders. Descriptive analytics examines what happened, while data mining searches larger datasets for patterns and anomalies. Together, these activities help teams move from information to considered action.
BI, analytics and big data
BI is the practical use of data analysis to understand business activity, while analytics is the broader set of methods used to interpret information. Big data describes datasets whose volume or complexity makes them harder to manage with basic tools. BI can use this data when systems organise and prepare it for analysis. Predictive analytics estimates possible future outcomes using algorithms, while real-time decisioning applies current information to decisions that need a timely response. Neither removes the need for human judgement.
BI software segments and providers
BI and analytics software includes tools for data preparation, querying, visualisation, reporting and predictive analysis. Providers may offer these capabilities in connected suites or specialised tools that work with an organisation’s existing data environment. BI analysts help make outputs useful: they clarify business questions, define measures, assess data quality, build reports and explain findings to decision-makers. They also help users distinguish an observed pattern from a reliable basis for action. The right software configuration depends on the questions teams need to answer and how their data is organised.
BI privacy, compliance and metrics
According to South Africa’s Information Regulator, POPIA regulates the processing of personal information by responsible parties within the Act’s scope and subject to its exclusions. BI teams should consider how their specific processing activities affect data access and use controls.
For IT dashboards, choose KPIs that connect operational activity with business priorities. Useful measures include service availability, incident volumes, resolution times, asset utilisation, licence usage, telecom expenditure by cost centre and budget variance. Define each metric consistently, assign an owner and set a review cadence. A dashboard is more actionable when users can see what changed, where it changed and who owns the next decision.
Business intelligence systems and data integration
A BI system connects data sources, prepares information for analysis and presents it through reports or dashboards. The integration design determines whether teams can compare business data consistently across applications.
Data warehouses and sources
A data warehouse stores organised information from sources such as finance systems, service applications, public datasets and IoT devices. It gives BI tools a prepared environment for analysis, rather than requiring each report to query disconnected systems independently.
For example, an IT dashboard might combine asset records with service-ticket data. The warehouse can align identifiers such as device names and department codes, allowing analysts to compare support demand with asset allocation. Clear ownership of source data also helps teams trace a metric back to the system that produced it.
Data collection and integration
Data collection brings records from relevant systems into the BI environment, while integration aligns them for shared use. A process might extract information from an asset register, a finance application and a service desk, then match common fields such as cost centre or asset identifier.
Connections can run on scheduled updates or respond to incoming changes, depending on how current the analysis needs to be. Integration rules also reconcile differences between sources, such as one application recording a department as “IT” and another as “Information Technology”. Without that alignment, a combined report could split one business unit into separate categories.
Data preparation and filtering
Data preparation cleans and structures collected records before analysis, while filtering selects information relevant to a specific question. Typical tasks include standardising dates, resolving duplicate records, handling missing fields and excluding entries outside the reporting period.
Consider a service report containing test tickets alongside genuine incidents. A documented filter can exclude test records while retaining the original data for traceability. Teams should also define how they treat incomplete records, because removing them may change totals or obscure an operational issue. These choices make the resulting metrics easier to interpret and reproduce.
Data intelligence and semantic layers
A semantic layer defines how BI tools interpret tables, fields, relationships, measures and access settings. It translates technical structures into agreed business terms, so different teams can use the same definition of a measure such as “active device” or “monthly service volume”.
Relationships matter as much as labels. If one asset record links to several service events, an incorrect join can duplicate asset counts in a report. A governed semantic model specifies relationship and calculation rules, helping analysts present comparable results across dashboards. It also clarifies which users can view particular data, supporting controlled access within the BI environment.
For organisations mapping these integration requirements, a BI governance discussion can help clarify data definitions, ownership and reporting priorities.
Business intelligence definition
Business intelligence (BI) combines processes and tools to turn organisational data into information for decision-making. For example, a leadership team can use a dashboard to compare service performance across departments and investigate changes before deciding what to do.
BI definition and purpose
BI helps an organisation examine past and current performance through analysis, reporting and visualisation. Its purpose is to make business information easier to interpret, not to replace judgement or decide automatically what should happen next. A monthly view of support incidents, for example, can show where demand rose and give managers a reference point for investigating the causes.
BI is related to data analytics, but the terms are not identical. Analytics includes methods for examining data, while BI applies those methods to business questions and presents findings for practical use. Predictive analysis may estimate future demand from past behaviour, but the forecast is an input to a decision, not a certainty.
Business intelligence model definition and purpose
A BI model is a structured representation of data that transforms raw records into information people can use for analysis. It defines how data fields relate, how measures are calculated and which business concepts they represent. For example, an IT organisation might define “service availability” by specifying the systems included and the calculation used.
Different models serve distinct purposes. A descriptive model summarises what happened, an analytical model applies methods to identify patterns, and a mathematical model can compare options through what-if analysis. These distinctions help teams choose a model suited to the decision, rather than treating every chart or calculation as interchangeable.
Semantic foundations and definitions
A semantic model gives business terms consistent meanings across reports. It can define fields, relationships, measures and access rules, allowing finance and IT teams to interpret a shared metric in the same way. Without those definitions, one dashboard might count an assigned device as active while another excludes it.
Documenting each measure’s meaning, source and calculation creates a useful reference for analysts and decision-makers. For instance, a “monthly incident count” should specify which records qualify and which reporting period applies. Consistent definitions make comparisons more meaningful and support organisation-wide, data-driven decisions.
Cloud, on-premises and hybrid BI models
Cloud BI runs on infrastructure accessed as a service, while on-premises BI operates on an organisation’s own infrastructure. Hybrid BI combines the two approaches, accommodating systems or data that remain in different environments.
The choice affects where data is processed, how systems connect and who manages the underlying infrastructure. A South African organisation might compare these models against its existing applications, data-access requirements and operational capabilities. The suitable arrangement is the one that supports its reporting needs while maintaining clear responsibility for data and system management.
Benefits and disadvantages of BI
BI can improve enterprise visibility by turning business records into comparable dashboards and reports. Its value depends on strategy, trusted data and whether teams can act on the findings.
Implementation benefits
Implementing BI can reduce manual reporting and help decision-makers identify operational patterns earlier. Coca-Cola Bottling’s automated BI system saved 260 hours a year by replacing manual reporting. In another example, Grupo Casas Bahia reduced data processing from five to six hours to minutes. These cases show how automation can free time for analysis, although results depend on how a system fits the organisation’s work.
Shared dashboards can give departments a common view of performance. For example, an IT team could compare service demand with an agreed forecast, then focus attention where actual activity differs. BI can inform action, but it neither makes decisions nor ensures that a chosen response will succeed.
BI strategy benefits
A BI strategy connects data investment to specific business priorities, such as service reliability, budget oversight or planning capacity. Precisely and Drexel University’s LeBow College of Business found that 76% of organisations identified data-driven decision-making as a leading goal of their data programmes. Clear priorities help teams choose relevant metrics and avoid building dashboards without a defined purpose.
Strategy also establishes who owns data definitions, reporting and follow-up. An enterprise could assign a metric owner, agree how a forecast will be reviewed and specify who acts on exceptions. Machine learning may support predictive analysis, but its outputs still need context and accountable interpretation. Without agreed responsibilities, even a technically sound insight can go unused.
Self-service and centralised BI
Self-service BI lets business users explore approved data and create their own views; centralised BI places more control with specialist teams. Self-service can shorten the path from question to analysis, while centralised reporting can strengthen consistency, access controls and metric definitions.
Each approach has trade-offs. Self-service can produce conflicting calculations, expose information too widely or encourage confidence in incomplete data. Centralised teams can apply stronger controls, but a queue of report requests may delay analysis. A governed combination often works well: specialists manage trusted data and core measures, while users explore permitted information within those standards.
BI also brings ongoing demands. Teams must maintain data quality, manage access, train users and assess software and licensing requirements. A forecast based on incomplete records may mislead, while a dashboard with too many measures can obscure the decision it should support. Review whether each report informs a defined action, and retire views that no longer serve a business need.
Regular reviews of dashboard ownership, data controls and decision outcomes help keep BI aligned with business priorities.
Torch Services: Telecom Expense Management
Torch Services offers Telecom Expense Management to organisations seeking stronger oversight of telecom expenditure. BI can reveal spending patterns, but those insights need clear ownership and follow-through to support financial control and accountability.
Turn to Telecom Expense Management when telecom costs are difficult to oversee or governance gaps make expenditure harder to assess. It complements business intelligence by focusing attention on telecom spending and the controls used to manage it. The aim is informed review and commercial optimisation, not dashboards for their own sake.
If telecom expenditure is a priority in your BI and governance work, contact Torch Services to discuss Telecom Expense Management.
Turn BI insight into accountable action
The next step is to connect insight to a decision owner, a defined measure and a practical review process. This discipline helps ensure IT business intelligence models inform priorities rather than simply adding dashboards to an already crowded reporting environment.
Where telecom expenditure, user support or asset oversight needs clearer governance, Torch Services offers Telecom Expense Management, automated user support and an asset management platform. These services address distinct operational needs, so the right focus depends on where visibility or accountability needs strengthening.
Start by identifying the business question your data should help answer, then clarify who will act on the result. A considered next step can turn clearer information into more confident decisions.
Frequently Asked Questions
How do you find the best BI and analytics software for your requirements?
Use a representative business task to assess software before selecting it. For example, ask finance and IT users to review the same telecom usage report, then compare whether each can find the relevant records and explain the result. Record manual workarounds, access issues and differences in interpretation. This practical evaluation shows whether a tool fits daily workflows, not simply whether it can produce an attractive demonstration.
How does BI work?
BI supports a decision cycle: a team identifies a business issue, reviews relevant evidence, decides on an action and later assesses the outcome. For example, an IT manager could investigate repeated support requests, assign a response and monitor whether the same issue continues. Connecting a decision to its later result helps teams learn from outcomes and refine operational policies, rather than treating each report as a one-off exercise.
What are the main business intelligence models used in IT?
IT teams often organise BI around business domains, such as service operations, asset lifecycle, technology expenditure or capacity planning. Each domain needs measures and dimensions suited to its decisions. An asset lifecycle view could group records by ownership status, location or support stage, while expenditure analysis could compare charges by department and service category. Choosing the right domain keeps reporting relevant to the team responsible for acting on it.
How do BI models differ from data analytics and data warehousing?
When a report produces an unexpected result, examine where the discrepancy enters the process. Compare a sample record with its original system entry, then trace how it was transformed and how the report calculated its measure. If the record is wrong at source, investigate the originating process; if it changes during preparation, review the transformation; if only the displayed result differs, inspect the model’s calculation. This diagnostic sequence helps target remediation.
What are the steps to design and implement a BI model for an IT business?
Start with a short decision charter stating the business question, intended users and action the analysis should inform. Assign owners for source records and metric definitions, then agree how users will test the output against known cases. Pilot the model with a small group, capture errors and revise definitions before wider release. After launch, log changes to calculations and communicate them to dashboard users to preserve consistent interpretation.
What data sources and architecture are needed for an IT business intelligence model?
Architecture should account for how each source changes over time, how records are matched and how analysts can trace results back to their origin. Document key identifiers shared between systems, the treatment of late-arriving updates and the lineage of important measures. For example, a device identifier that changes after reassignment needs a reliable way to connect historical activity with its current record. These design decisions support traceable analysis as systems evolve.